


Support and Resistance in Stock Market Explained
Learn what is support and resistance in stock market in simple terms. Ideal for beginners in stock market course online or share market course online.
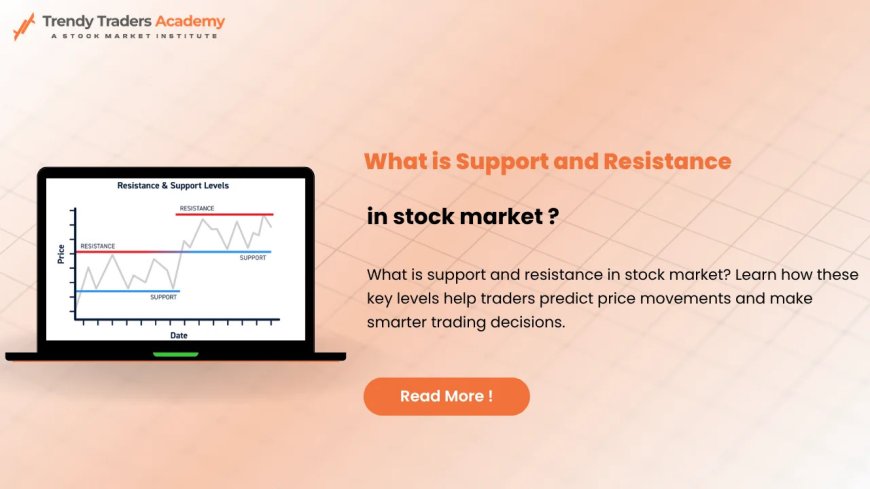
What is Support and Resistance in Stock Market?
Introduction
Have you ever watched a stock move up and down like it's hitting an invisible ceiling or bouncing off a hidden floor? That's support and resistance in actiona concept that every trader, from beginner to expert, relies on to make smarter decisions. Whether youre exploring a stock market course online or dipping your toes into a share market course online, understanding these two levels is like learning the ABCs of trading.
Lets break this down in plain Englishno jargon, just real talk and relatable examples. Think of support and resistance as the guardrails that guide the rollercoaster ride of stock prices. Buckle up!
Learn what is support and resistance in stock market in simple terms. Ideal for beginners in stock market course online or share market course online.
What is Support in Stock Market?
Support is like a cushion or floor beneath the price of a stock. Its a price level where a stock tends to stop falling and may even bounce back up.
Analogy: Imagine dropping a rubber ball. When it hits the ground (support), it bounces back. That ground is the support level.
Key Point: Buyers tend to enter at support levels, thinking the price is low and worth investing in.
What is Resistance in Stock Market?
Resistance is the ceiling for a stock pricea level where it tends to stop rising and might fall again.
Think of it this way: Youre trying to push a balloon upward, but it hits the ceiling and can't go higher. That ceiling is the resistance level.
Key Point: Sellers often come in at resistance levels, thinking the price is too high to hold.
Why Support and Resistance Matter?
Why do traders care about these invisible lines?
-
Predict Price Movement: These levels help forecast where a stock might move next.
-
Set Buy and Sell Targets: Traders buy near support and sell near resistance.
-
Risk Management: Stop-loss orders are placed just below support or above resistance.
How to Identify Support and Resistance
You dont need magicjust some observation skills.
-
Historical Price Points: Look at past charts to see where prices tend to bounce or reverse.
-
Volume Clues: Higher trading volumes often confirm these levels.
-
Multiple Touches: If a price hits the same level multiple times, it strengthens the case.
The Psychology Behind Support and Resistance
Support and resistance arent just numbersthey reflect the emotions of the market.
-
Support = Fear of Missing Out (FOMO): Buyers rush in fearing the price will go up.
-
Resistance = Fear of Loss: Sellers offload fearing the price might fall.
The market is a crowd, and these levels are where crowd behavior becomes predictable.
Types of Support and Resistance
Lets get a bit deepersupport and resistance come in different forms:
-
Horizontal Levels: Simple, straight lines based on past highs/lows.
-
Trendline Support/Resistance: Slanted lines following a trend.
-
Moving Average Lines: Dynamic levels that move with the price.
Example: The 50-day moving average often acts as both support and resistance.
Support and Resistance in Technical Analysis
If youre taking a stock market course online, this will be a crucial chapter.
-
Chart Patterns: Head & Shoulders, Triangles, and Flags all revolve around support/resistance.
-
Breakouts: When prices break through resistance, they can surge upward.
-
Breakdowns: When they fall below support, its often a red flag.
Common Tools to Mark Support/Resistance
Here are some tools used by traders and students of any share market course online:
-
Line Charts
-
Candlestick Charts
-
Fibonacci Retracement
-
Pivot Points
These tools make it easier to spot those bounce and ceiling zones.
False Breakouts: Dont Get Tricked!
Sometimes prices break past support/resistancebut only temporarily.
-
Trap Alert: New traders may buy on a breakout, only to watch the price fall back.
-
Confirmation: Wait for a retest or multiple candles before jumping in.
Pro Tip: Combine support/resistance with volume analysis to avoid getting duped.
How Traders Use These Levels
-
Day Traders: Use tight support/resistance to scalp profits.
-
Swing Traders: Look for medium-term setups.
-
Long-term Investors: Use major levels to find entry and exit points.
Smart Strategy: Buy near support, sell near resistance. Classic yet effective.
Support and Resistance vs Indicators
Indicators like RSI or MACD are great, but support/resistance is foundation-level knowledge.
-
Indicators Lag: They confirm trends after they happen.
-
Support/Resistance is Real-Time: It helps you act before the big move.
A great strategy? Combine both for maximum accuracy.
Real-Life Examples You Can Relate To
-
Reliance Industries: Often faces resistance around ?2,800 and support near ?2,500.
-
TCS: Known for bouncing from support at ?3,200.
-
Nifty 50: Traders track support/resistance religiously at psychological levels like 20,000.
Homework: Pick a stock you like and spot support/resistance on its chart.
Support & Resistance for Beginners
Just starting out? Heres a beginner-friendly cheat sheet:
-
Use free charting tools like TradingView or Zerodha Kite.
-
Dont overcomplicatestart with horizontal lines.
-
Track and journal how prices react at these levels.
Best Part: You dont need fancy toolsjust observation and patience.
Best Resources to Learn More
Want to go beyond the basics? These can help:
-
Online Platforms: Enroll in a stock market course online from trusted sources.
-
Books: Try Technical Analysis of Financial Markets by John Murphy.
-
YouTube Channels: Several offer free lessons on support and resistance.
Final Thoughts on Mastering the Basics
Support and resistance arent just lines on a chartthey're reflections of human behavior. Once you understand how traders think, these levels become powerful tools in your trading toolkit.
Whether you're pursuing a stock market course online or simply exploring the share market course online options, mastering support and resistance gives you a huge edge. Start small, stay curious, and practice consistently.
FAQs
1. Can support become resistance and vice versa?
Yes, its common. Once a support level is broken, it can act as resistance, and vice versa.
2. Is support and resistance only for short-term trading?
Not at all. These levels are used by day traders, swing traders, and long-term investors alike.
3. How accurate are support and resistance levels?
Theyre not foolproof, but theyre reliable when combined with volume, price action, and confirmation signals.
4. Do I need technical tools to find support/resistance?
While tools help, basic chart observation is often enough for beginners.
5. Can I learn this through a share market course online?
Absolutely. Many beginner-friendly courses online explain these concepts in detail with live examples.